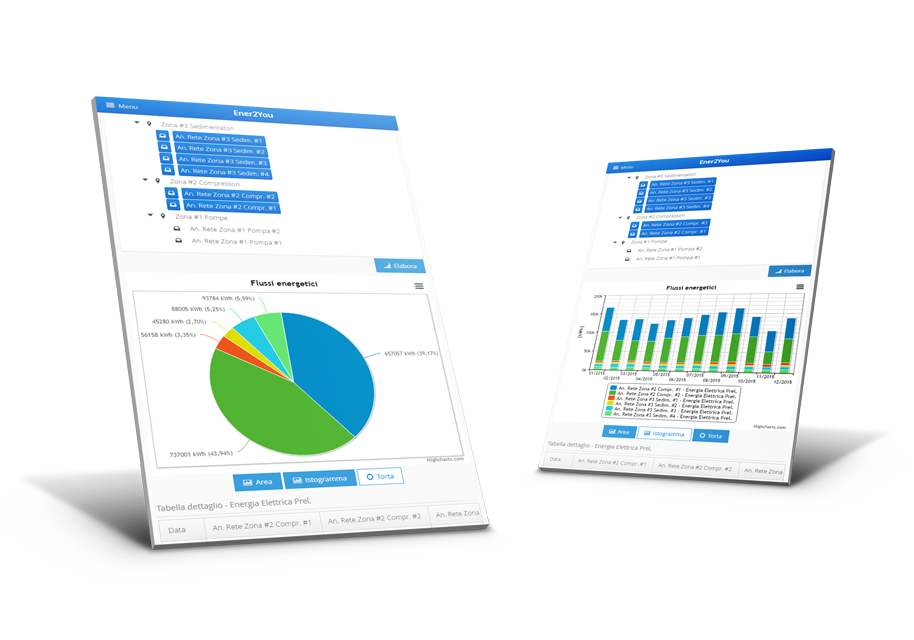
Ener2You Monitoring
Comprehensive and real-time monitoring of energy flows, designed according to the actual needs of users and technicians and according to the latest European directives.
Time Slots Pricing Reports
Tabular reports on consumption of a given energy vector according to its own time slots pricing. Data analysis, highlighted with […]
Characteristic Curves Reports
Graphical reports on the average energy flows for specified time intervals based on the “factory calendar”. Thus you can have […]
Hourly Consumption Distribution
Tabular report showing the hourly distribution of daily consumption of a selected energy vector. This analysis allows to immediately identify […]

