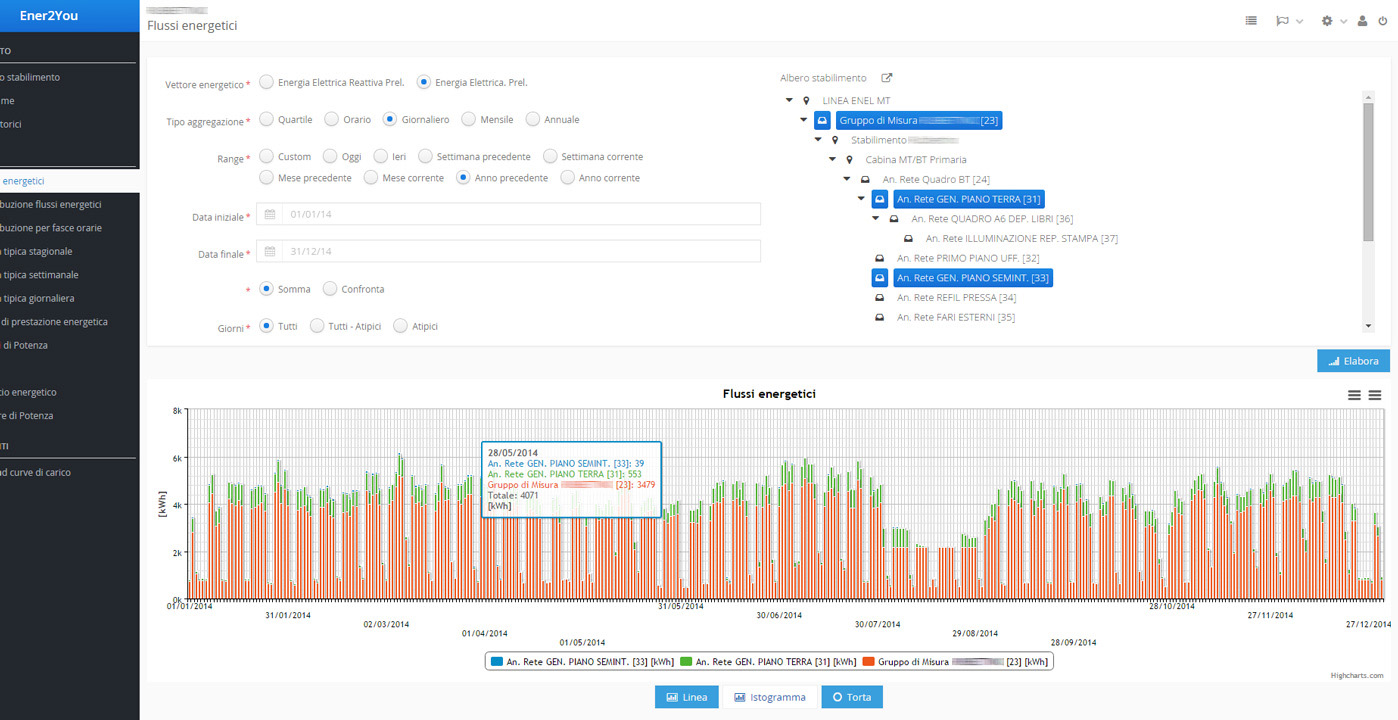
The portal can generate tabular and graphical reports to analyze flows coming from various energy vectors, by aggregating the measures according to set time intervals (fifteen minutes, hour, day, week, month, year).
The system also allows to establish the detail level of the analysis which is to be performed by grouping or comparing the various devices organized into “zones” within the tree diagram of the plant.